The YouTuber CNLohr developed a low-tech tool to map the WiFi signal of any 3D space

How it works
His tools are an ESP8266
Wi-Fi module, a single WS2812 LED and a little Hubsan battery pack. His computer connects to the ESP8266 to ping it; an application on his computer looks at RX power of those pings and sent color to the ESP82665.
Long exposure photo and 2D maps
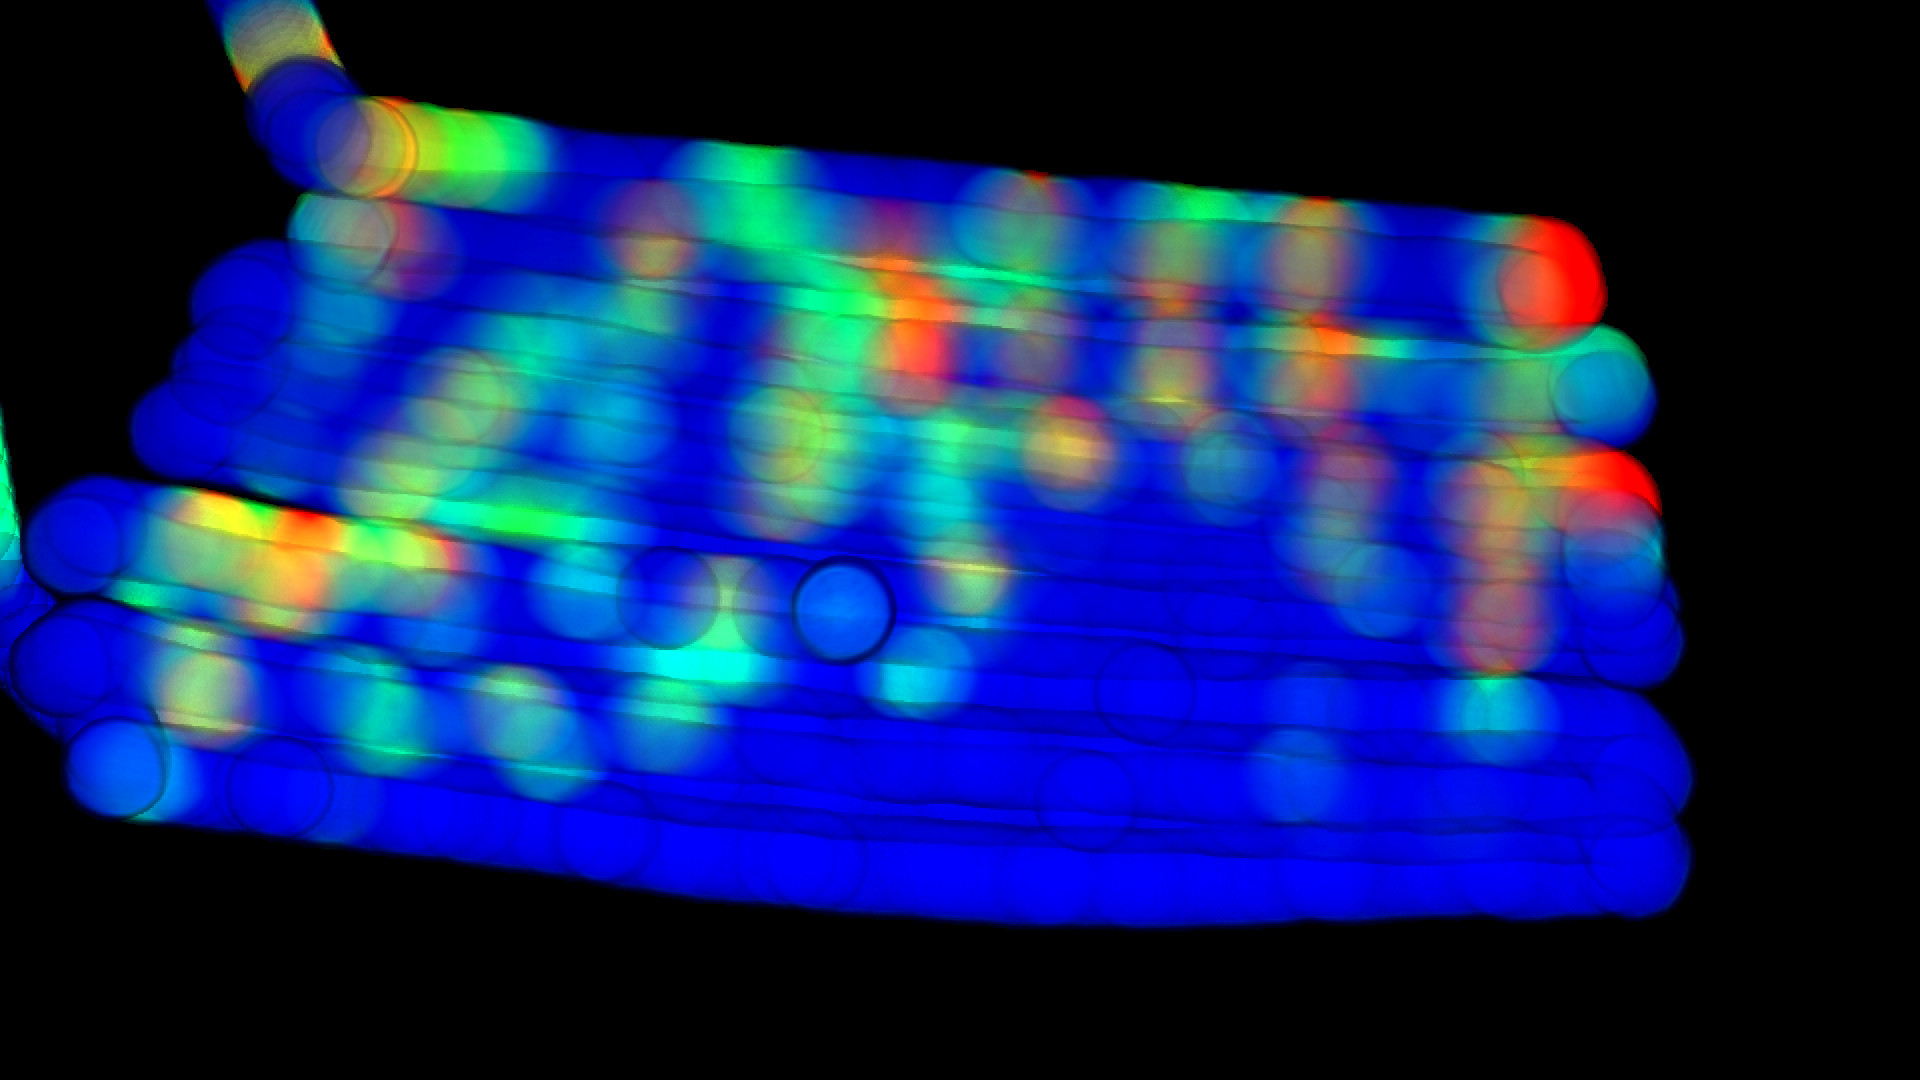
The color told the actual RX power in every point of the space. This is the super long exposure photo of this color changes:

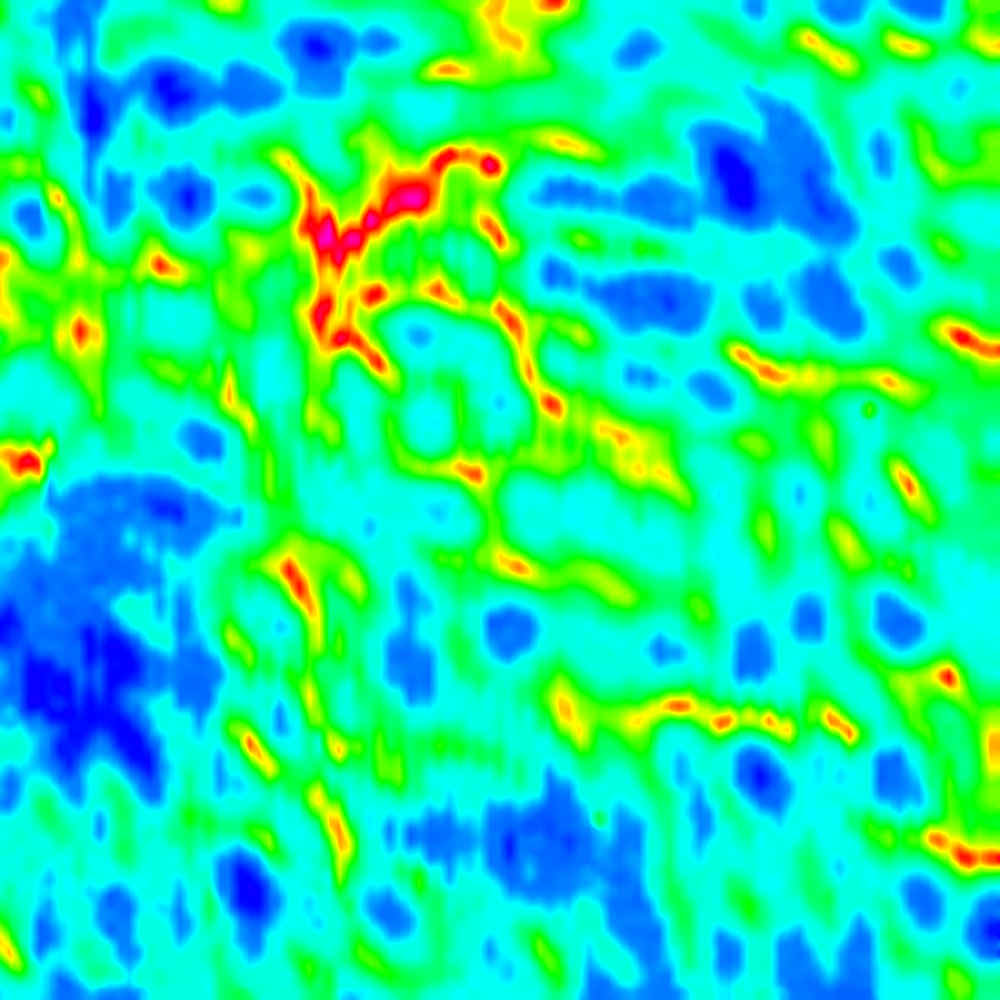
To get better and more precise results, he used a mill to follow a basic zig-zag pattern. The position of the mill was recorded together with the WiFi signal strength.
This is the 2D map:

3D mapping
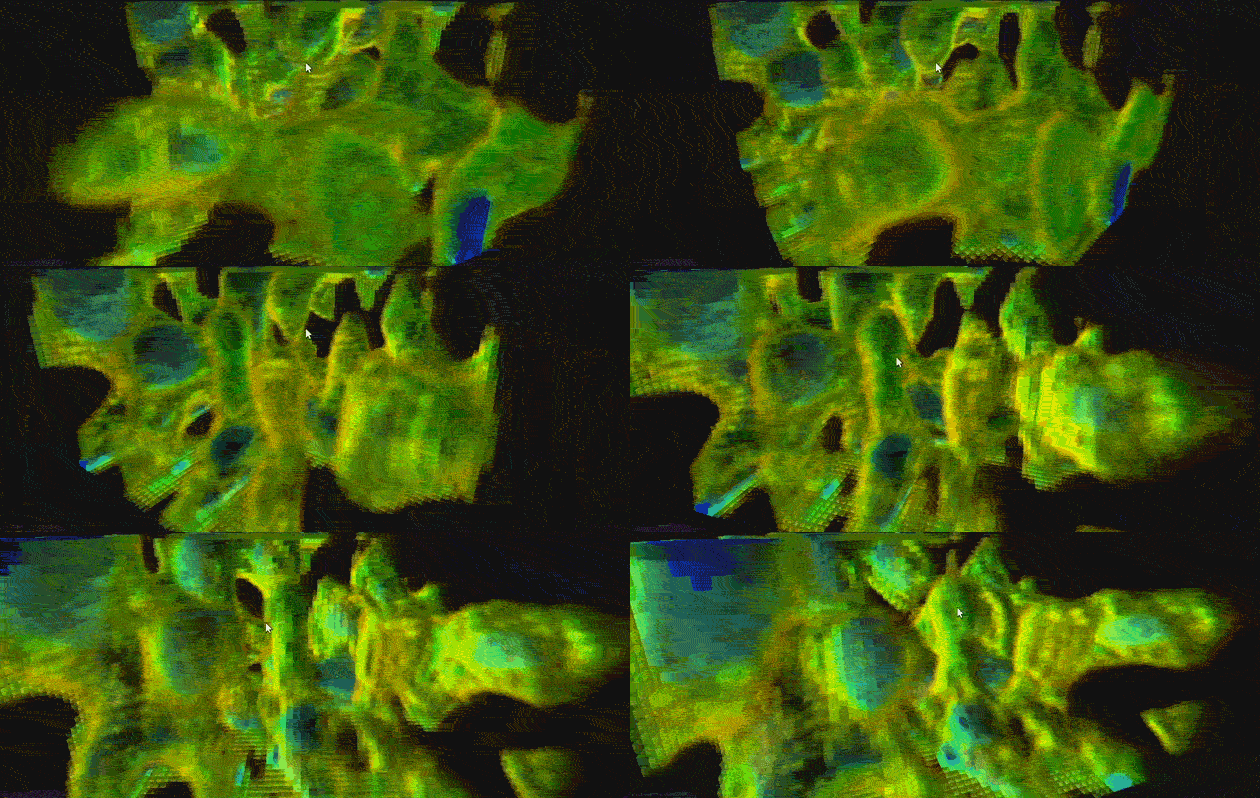
He added a third dimension and he records results of a 360x360x180 mm area. This is the 3D representation of the data.
As you see in the video, the areas that are denser are the ones where the signal was particularly good. The open areas are the ones where the signal was poor.
You can play with this 3D heat map at http://cnlohr.github.io/voxeltastic/
Related article >> Wi-Fi Stumblers Complete List
